Data Visualization with D3.js
Teacher: Fabio Franchino — TODO
Immersive lecture on the key elements and concepts behind data visualization.
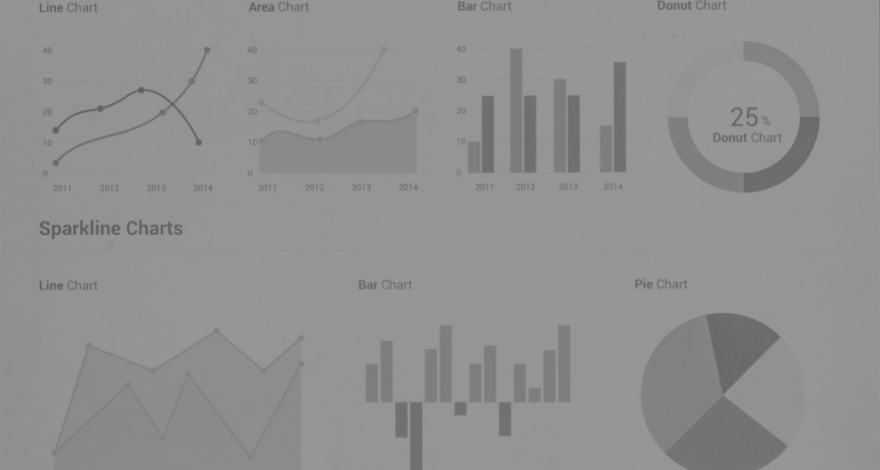
The workshop is an immersive tutorial about how to use the JavaScript open source library D3.js to represent data and to create customized and animated diagrams and charts.
Duration: 1.5 days.
Prerequisites: HTML, CSS, previous experience with JavaScript is welcome.
#dataviz #datavisualization #d3js #javascript

Recent Comments