Automating satellite-based ice charting using AI
Speaker: Leif Toudal Pedersen — Technical University of Denmark
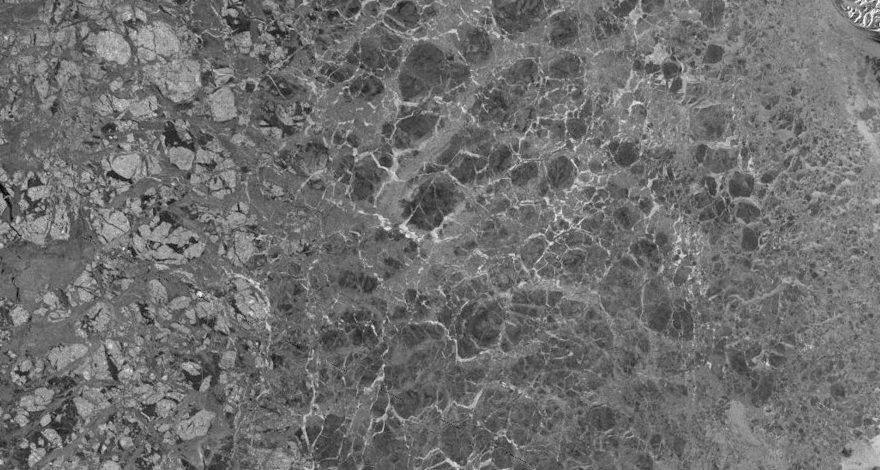
High resolution Synthetic Aperture Radar (SAR) satellite images are used extensively for producing sea ice charts in support for Arctic navigation. However, due to ambiguities in the relationship between C-band SAR backscatter and ice conditions (different ice types and concentrations as well as different wind conditions have the same backscatter signature) the process of producing ice charts is done by manual interpretation of the satellite data. The process is labour intensive and time consuming, and thus, the number of charts that are produced on a given day is limited.
Automatically generated high resolution sea ice maps have the potential to increase the use of satellite imagery in ice charting by providing more products and at shorter delays between acquisition and product availability.
While the 40m pixel size in Sentinel-1 data potentially enables extraction of ice information at an unprecedented high resolution, the supplementary coarser resolution AMSR2 measurements may contribute with a higher contrast between ice and water and less sensitivity to wind conditions over the ocean.
For the study a dataset of ice charts and corresponding co-located Sentinel-1 SAR and AMSR2 microwave radiometer imagery has been collected. The dataset may be split for training, testing and validation as appropriate.
Prerequisites: Data files are in NetCDF format, so you should be able to read and digest those. Basic knowledge of microwave remote sensing may be useful.
#SAR #AMSR2 #satellite #Sentinel1 #seaice

Recent Comments